Late in pregnancy, an obstetrician wants to know whether the fetus is too small. A growth-restricted baby may need closer monitoring or an early delivery
You can’t put a fetus on a scale –> You need something you can measure, from the mother, that tracks the fetus
1960s answer: measure a hormone in the mother’s urine that the fetus itself helps to make
Question: Can a urine test taken before delivery tell us how big the baby will be?
Estriol: a hormone the fetus helps make
Estriol (E3) is one of the three main oestrogens (with estrone E1 and estradiol E2). It is usually not found outside pregnancy. In pregnancy its synthesis takes three organs, two of them fetal:
Most pregnancy estriol is built from fetal precursors, so it depends on a working fetus and a working placenta
A bigger, healthier feto-placental unit should make more of it. Hence, Low maternal estriol = warning sign
The data
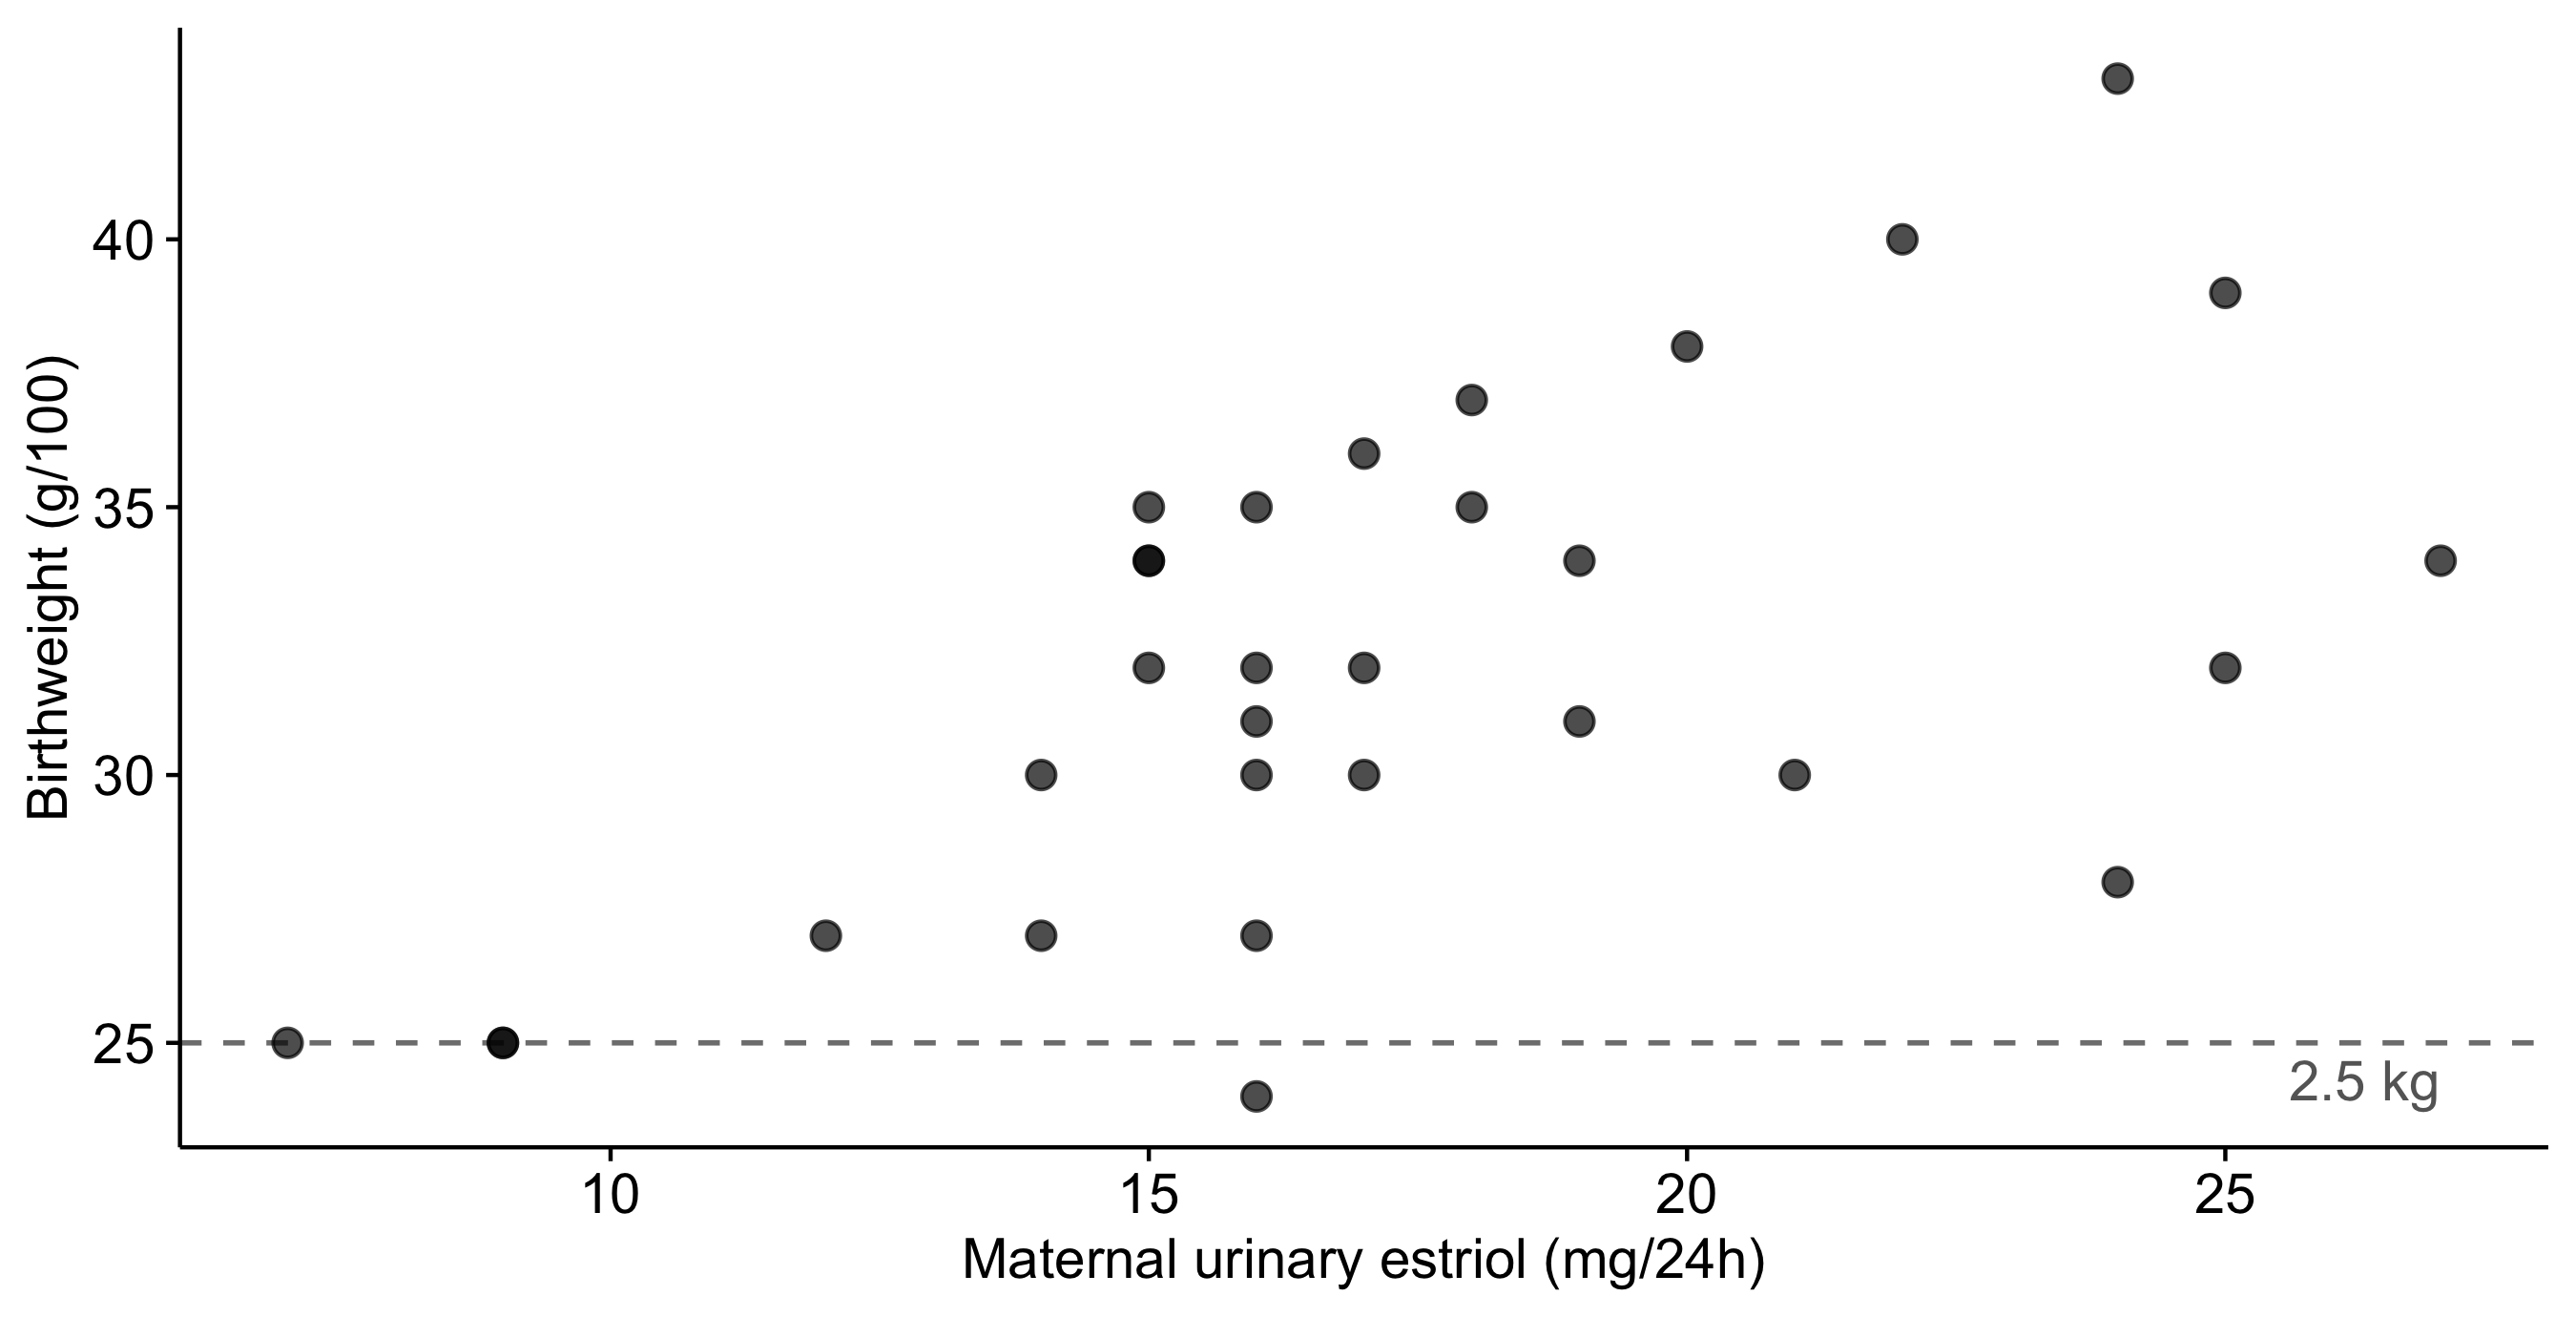
31 pregnancies. Birthweight is in units of 100 g, so 25 = 2.5 kg, the usual low-birthweight cut-off
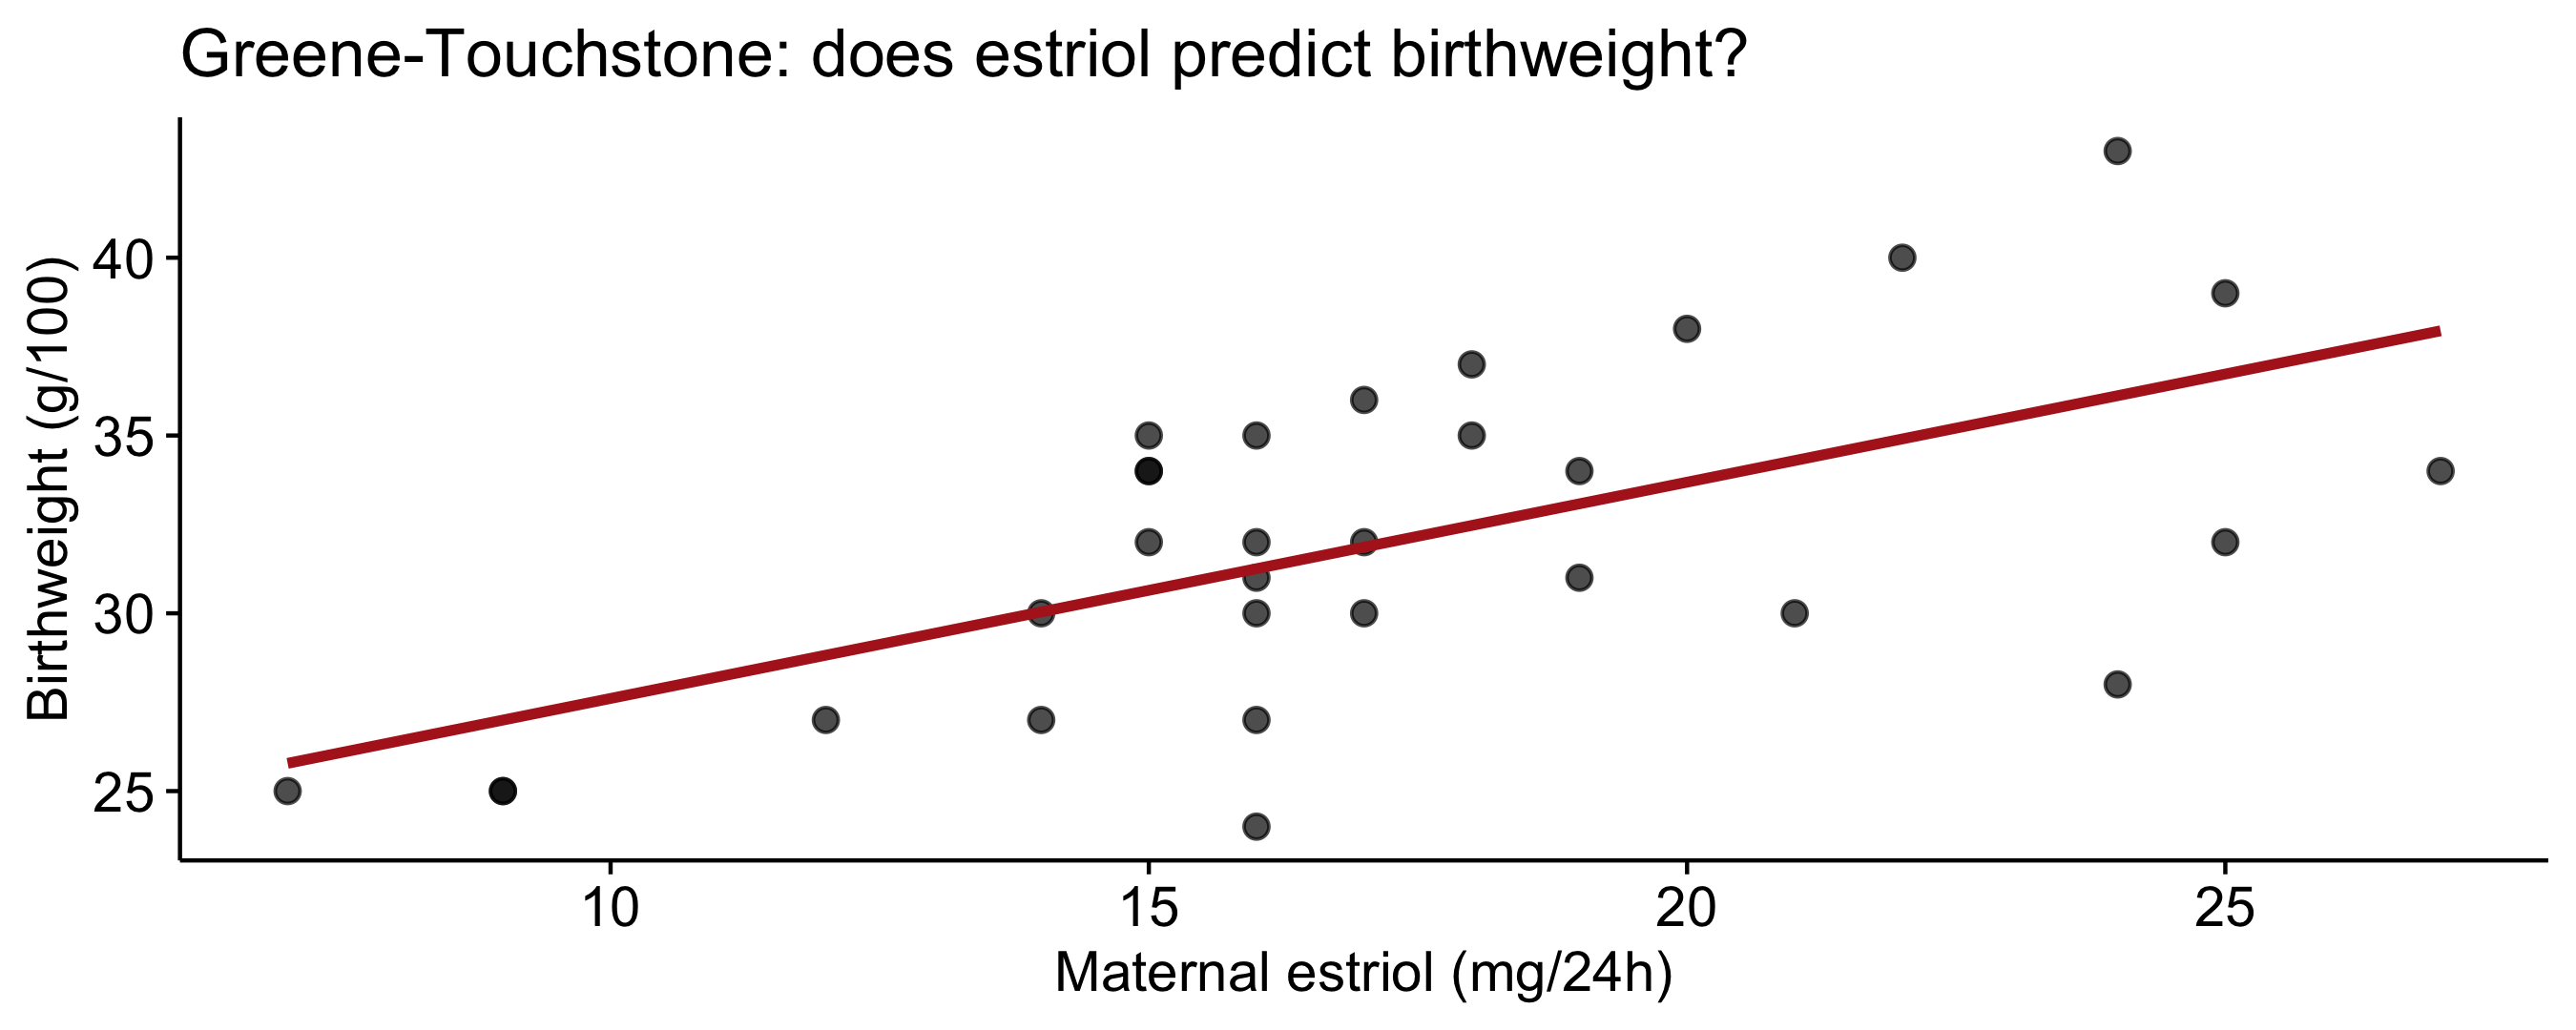
Higher estriol tends to go with heavier babies, but the cloud is wide
How should we model it?
The obstetrician’s questions:
Is there a real relationship, or could this pattern be noise?
How many grams of birthweight go with each extra mg/24h of estriol?
A mother’s estriol is 10 mg/24h. What birthweight should we expect, and how sure are we about this baby?
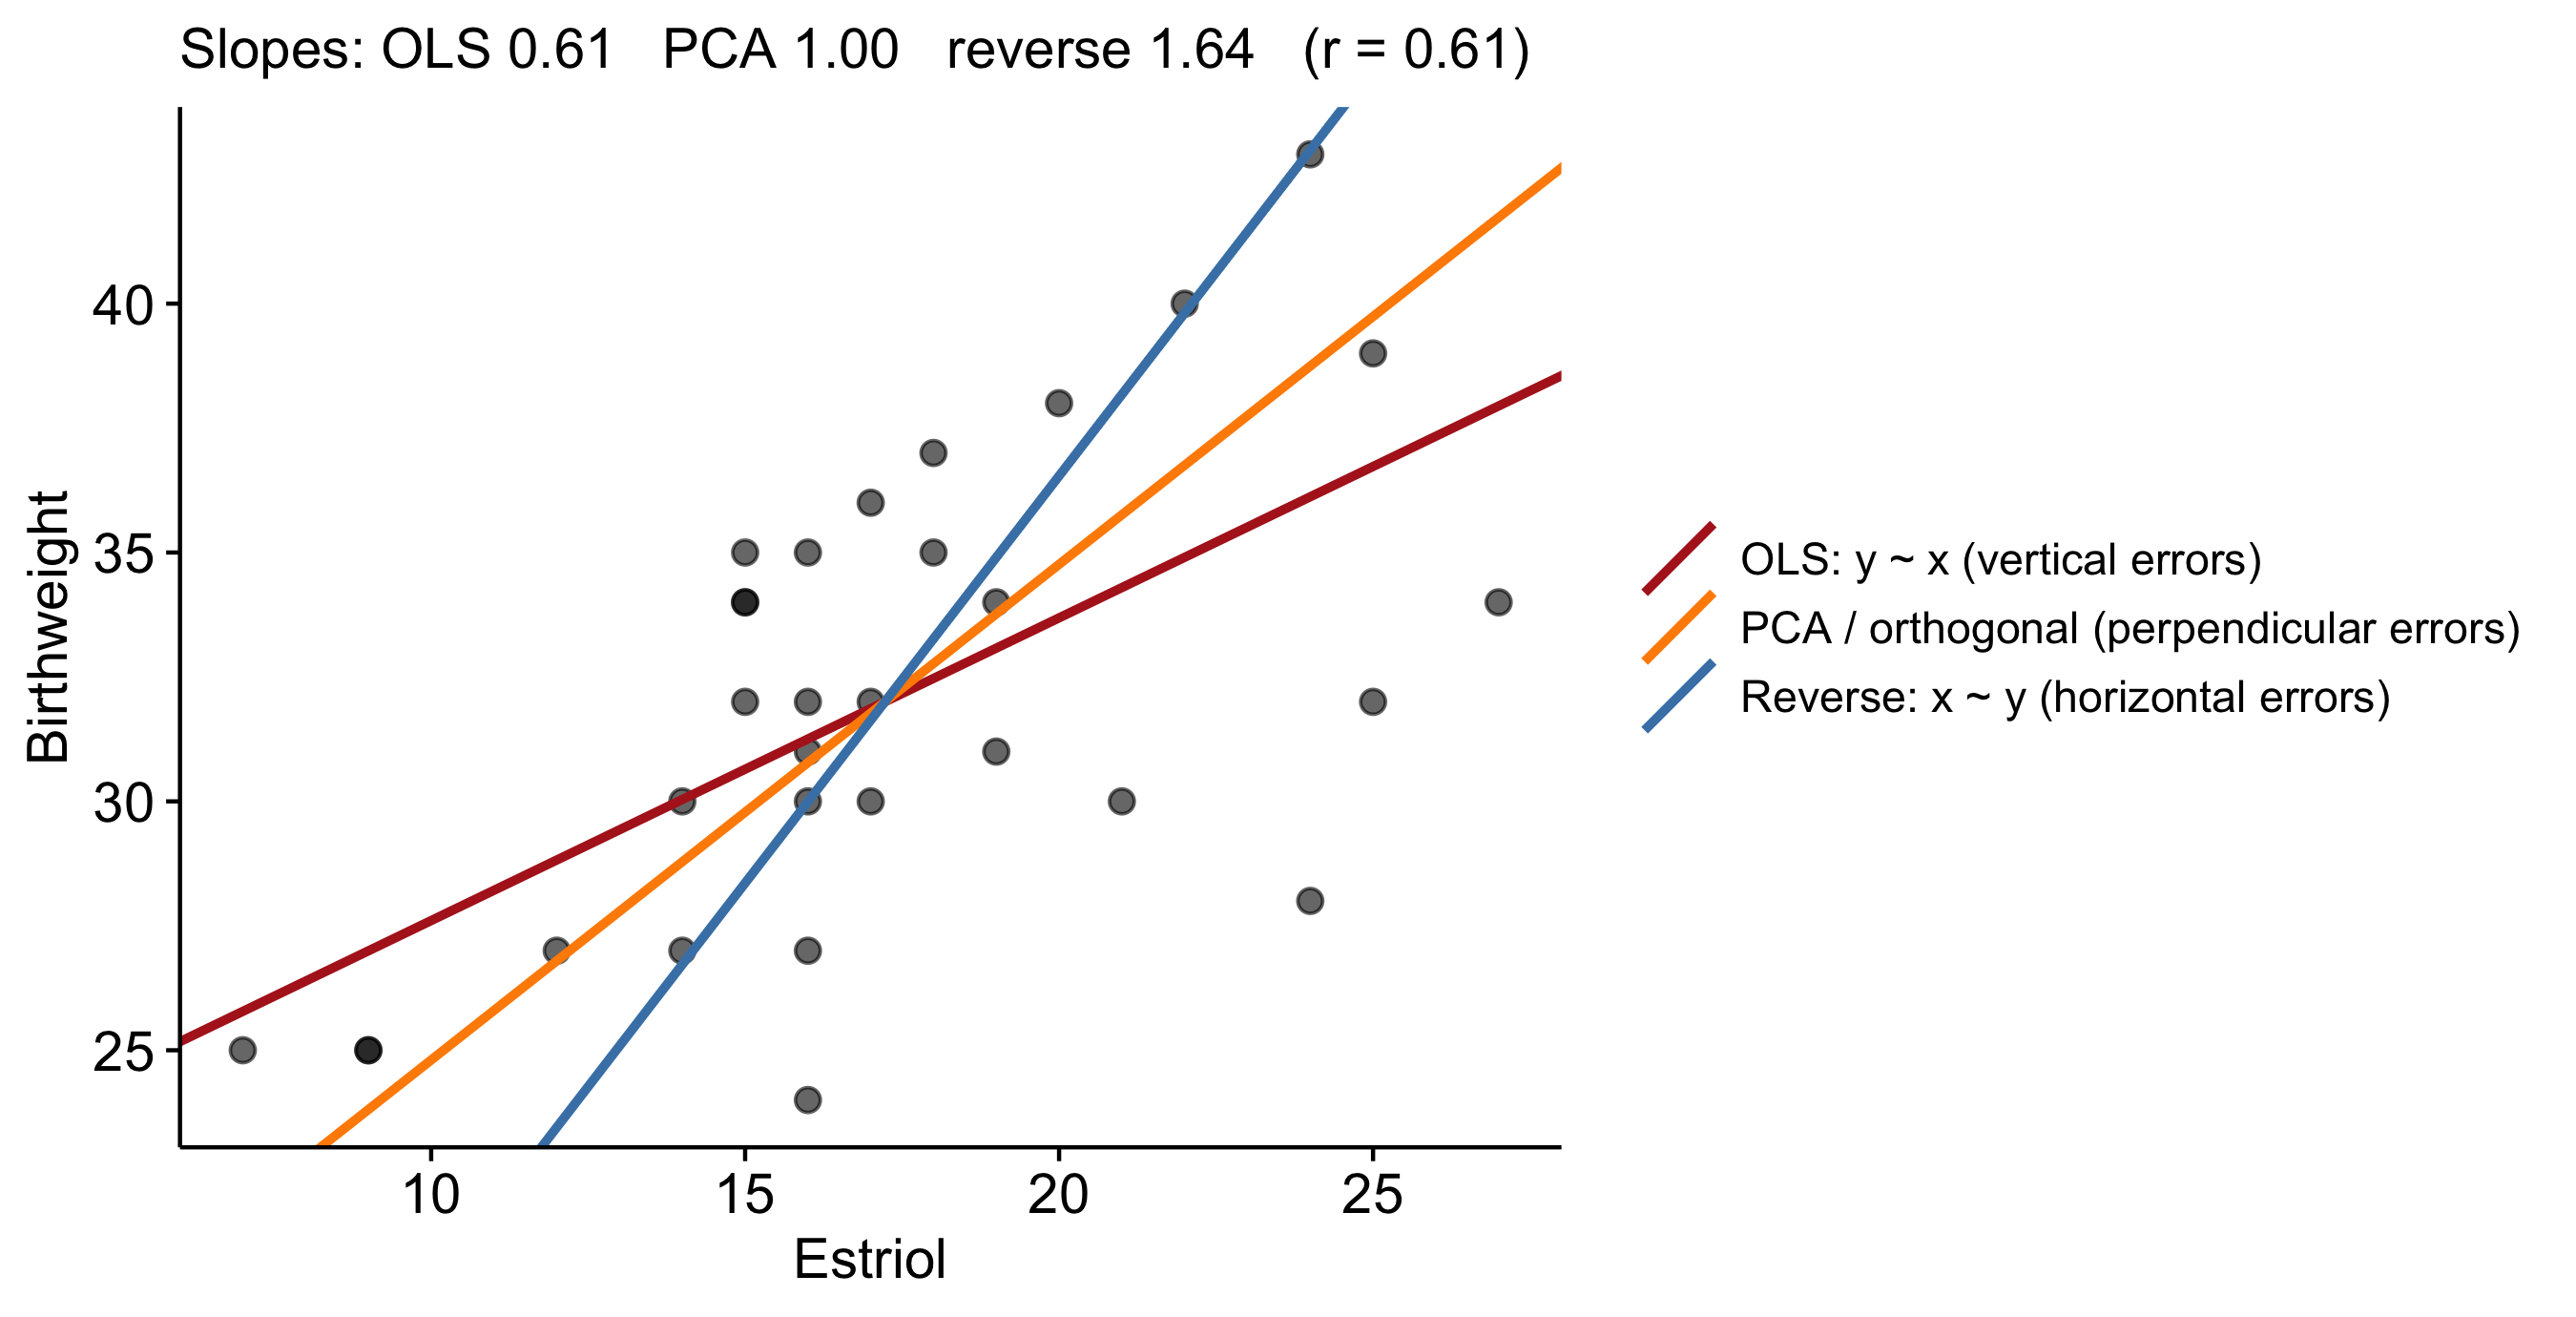
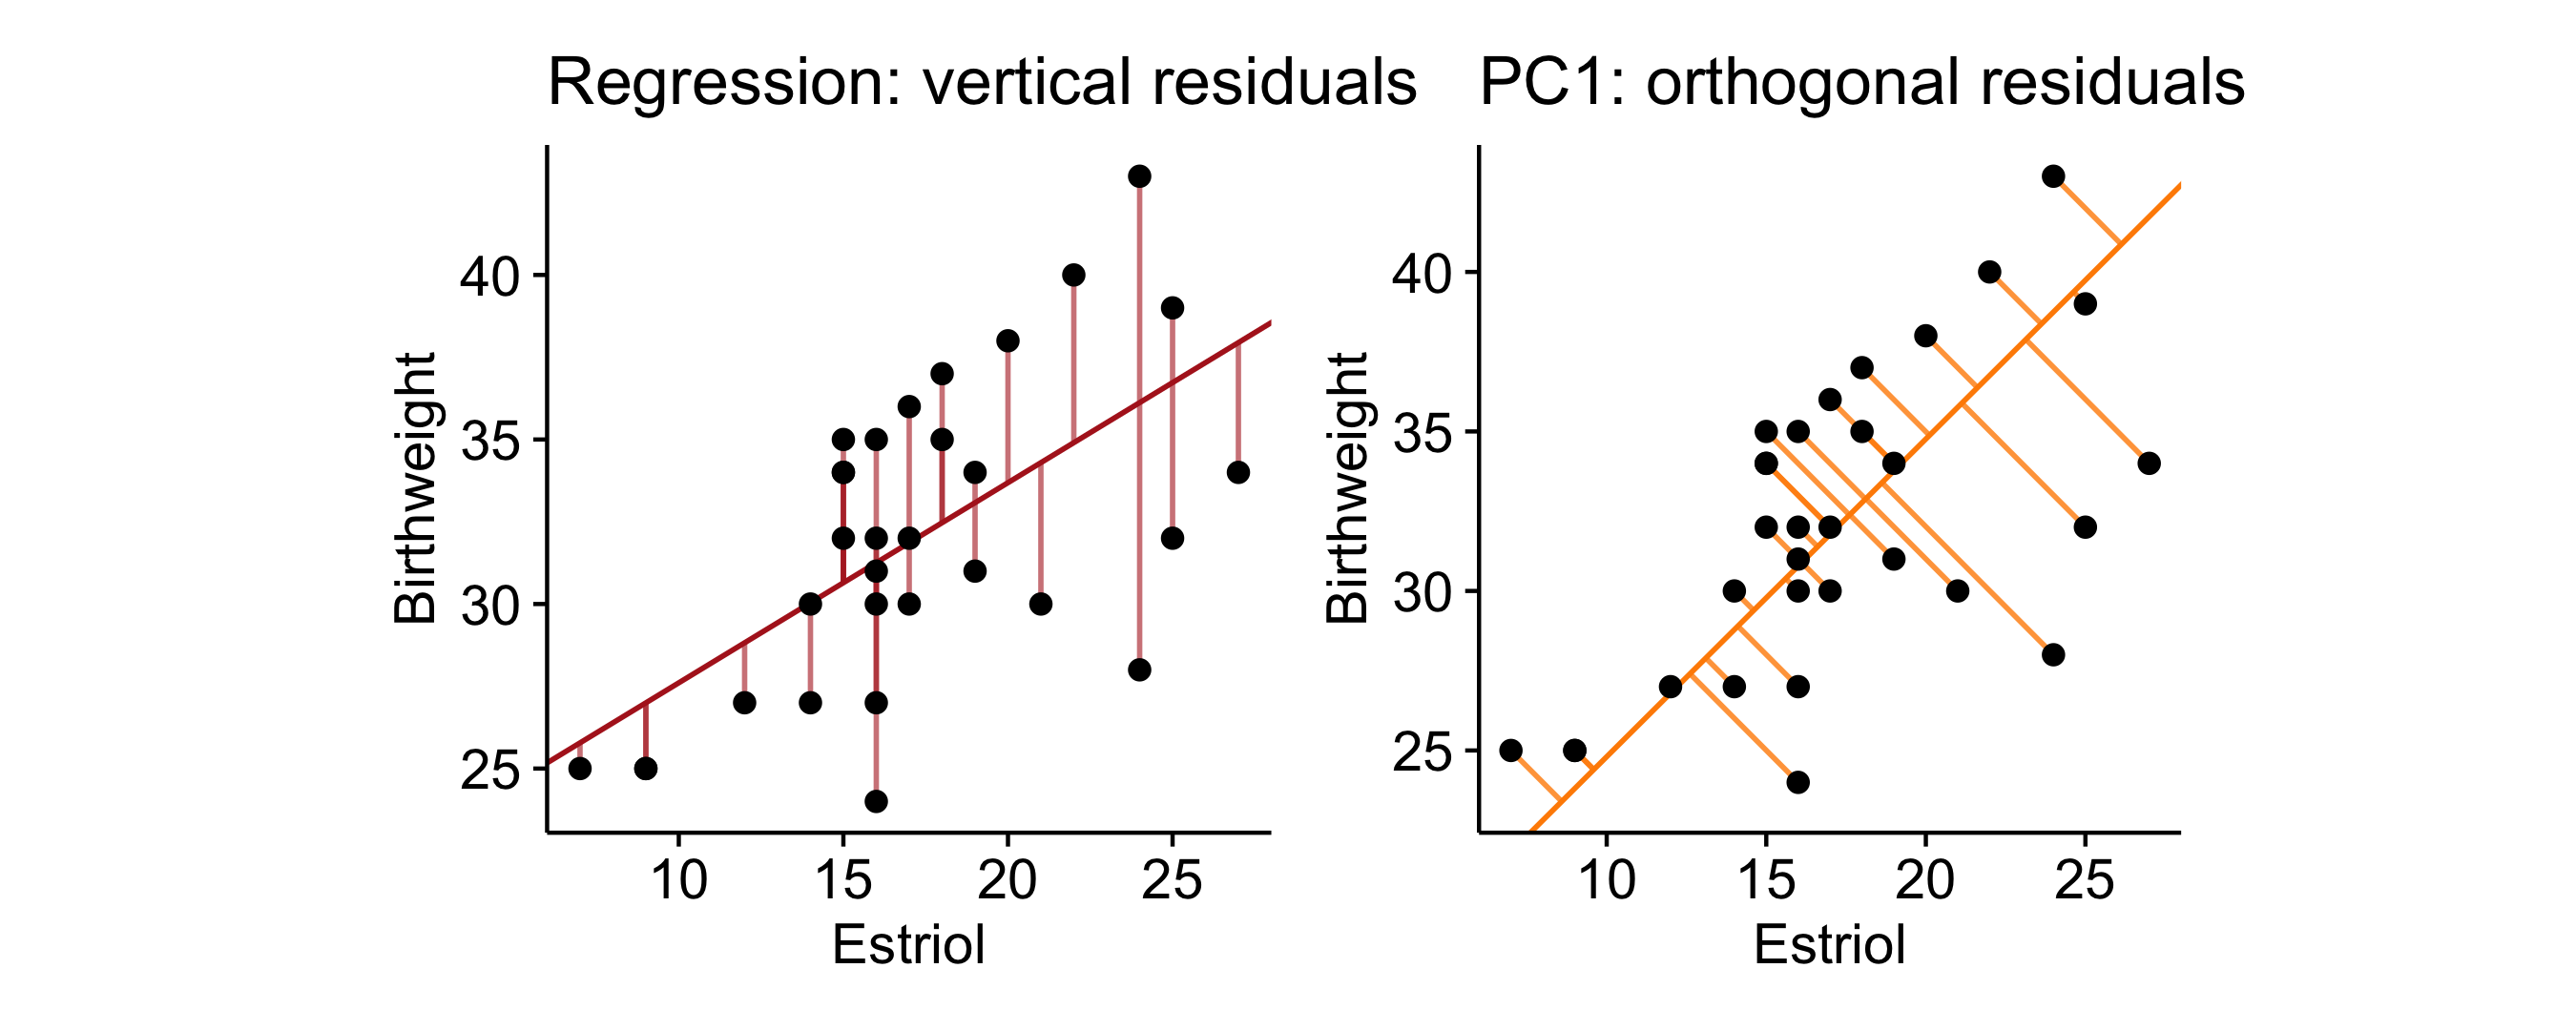
There are many lines through a cloud. Which one, and why?
Does it still hold once we account for other things (gestational age, maternal smoking)?
How should we model it?
Tools you already:
The correlation\(r\) answers 1, but not 2 or 3
Splitting estriol into “low” and “high” and running a two-sample\(t\)-test answers a cruder version of 1 and throws information away
Drawing a line by eye answers 2 and 3, but everyone can draw a different line
Today: one model, \(\;\text{birthweight} = \beta_0 + \beta_1\,\text{estriol} + \varepsilon\), answers 1-4. Adding predictors to it answers 5, and the \(t\)-test turns out to be a special case of it.
Regression models a conditional distribution
Data: pairs \((x_i, y_i)\), \(i = 1,\dots,n\). Goal: describe how the distribution of\(Y\) changes with \(x\), most often its mean \[\mu(x) = \mathbb{E}[Y \mid X = x]\]
“Regression” comes from Galton (1886): tall parents have children who are, on average, tall but less extreme, a “regression towards mediocrity” (more on this soon)
The asymmetry matters: we model \(Y \mid X\), not the joint distribution of \((X, Y)\). \(X\) is treated as known/fixed
\(\boldsymbol\varepsilon \mid \mathbf X \sim N(\mathbf 0, \sigma^2\mathbf I)\)
Exact\(t\) and \(F\) tests at any \(n\); OLS = MLE
LINE: L = Linear (A1), I = Independent and E = Equal variance (A3), N = Normality (A4) (strictly, A3 only needs uncorrelated errors; “independent” is stronger, and the two coincide under A4)
Not assumed: \(Y\) marginally normal; \(X\) normal; \(X\) random at all
Large \(n\): by the CLT, \(\hat{\boldsymbol\beta}\) is approximately normal without A4. Normality matters most for small samples and for prediction intervals
Violating A3 leaves \(\hat{\boldsymbol\beta}\) unbiased but makes the standard errors wrong (fix: GLM)
Least squares
Choose \(\boldsymbol\beta\) to minimise the residual sum of squares \[\text{RSS}(\boldsymbol\beta) = \sum_{i=1}^n (y_i - \mathbf x_i^\top\boldsymbol\beta)^2 = \lVert \mathbf y - \mathbf X\boldsymbol\beta\rVert^2\]
Set the gradient to zero: \[\nabla_{\boldsymbol\beta}\,\text{RSS} = -2\mathbf X^\top(\mathbf y - \mathbf X\boldsymbol\beta) = \mathbf 0
\quad\Longrightarrow\quad
\underbrace{\mathbf X^\top\mathbf X\,\hat{\boldsymbol\beta} = \mathbf X^\top\mathbf y}_{\text{normal equations}}\]\[\hat{\boldsymbol\beta} = (\mathbf X^\top\mathbf X)^{-1}\mathbf X^\top\mathbf y\]
The fitted line always passes through \((\bar x, \bar y)\)
The slope is the correlation, rescaled into the units of \(y\) per unit of \(x\)
X <-cbind(1, estriol_df$estriol); y <- estriol_df$birthweightsolve(t(X) %*% X, t(X) %*% y) |>t() # normal equations by hand
         [,1]      [,2]
[1,] 21.52343 0.6081905
coef(lm(birthweight ~ estriol, data = estriol_df))
(Intercept)     estriol
 21.5234286   0.6081905
Least squares is a projection
\[\hat{\mathbf y} = \mathbf X\hat{\boldsymbol\beta} = \underbrace{\mathbf X(\mathbf X^\top\mathbf X)^{-1}\mathbf X^\top}_{\mathbf H\ \text{(hat matrix)}}\mathbf y,
\qquad \mathbf e = \mathbf y - \hat{\mathbf y} = (\mathbf I - \mathbf H)\mathbf y\]
\(\mathbf H\) is symmetric and idempotent (\(\mathbf H^2 = \mathbf H\)): the orthogonal projection of \(\mathbf y \in \mathbb R^n\) onto the column space of \(\mathbf X\)
The normal equations say \(\mathbf X^\top\mathbf e = \mathbf 0\): residuals are orthogonal to every predictor. With an intercept this gives \(\sum e_i = 0\), \(\sum x_{ij} e_i = 0\), \(\sum \hat y_i e_i = 0\)
Pythagoras in \(\mathbb R^n\) (for a model with an intercept, so \(\mathbf 1\) is in the column space of \(\mathbf X\)): \[\underbrace{\lVert\mathbf y - \bar y\mathbf 1\rVert^2}_{\text{TSS}} = \underbrace{\lVert\hat{\mathbf y} - \bar y\mathbf 1\rVert^2}_{\text{SS}_{\text{reg}}} + \underbrace{\lVert\mathbf e\rVert^2}_{\text{RSS}}\]
\(\operatorname{tr}(\mathbf H) = p\), \(\operatorname{tr}(\mathbf I - \mathbf H) = n - p\)
These above traces are the degrees of freedom: \(\mathbf y\) is in \(n\) dimensions, the fit uses \(p\), and the residuals live in the remaining \(n-p\)
For any \(\sigma^2\), maximising \(\ell\) over \(\boldsymbol\beta\) is minimising RSS, so OLS = MLE under Gaussian errors
MLE of variance: \(\hat\sigma^2_{\text{ML}} = \text{RSS}/n\), which is biased: \(\mathbb E[\text{RSS}] = \sigma^2\operatorname{tr}(\mathbf I - \mathbf H) = \sigma^2(n-p)\). So we use \(s^2 = \text{RSS}/(n-p)\) (R’s “residual standard error” is \(s\))
\(\sigma^2\) is unknown; estimate it by \(s^2 = \text{RSS}/(n-p)\)
Under A4: \(\hat{\boldsymbol\beta}\) depends on \(\mathbf H\mathbf y\), RSS on \((\mathbf I-\mathbf H)\mathbf y\). These are orthogonal projections of a Gaussian vector, so they are independent, and \[\frac{(n-p)s^2}{\sigma^2}\sim\chi^2_{n-p}\]
Therefore \[T_j = \frac{\hat\beta_j - \beta_j}{\widehat{\text{SE}}(\hat\beta_j)} \sim t_{n-p},\qquad \widehat{\text{SE}}(\hat\beta_j) = s\sqrt{[(\mathbf X^\top\mathbf X)^{-1}]_{jj}}\] (\(N(0,1)\) divided by \(\sqrt{\chi^2_{n-p}/(n-p)}\), independent: that is the definition of \(t_{n-p}\))
If \(\sigma\) were known, \(T_j\) would be exactly \(N(0,1)\): the \(z\)-test. As \(n\to\infty\), \(t_{n-p}\to N(0,1)\) anyway
fit <-lm(birthweight ~ estriol, data = estriol_df)summary(fit)$coefficients
              Estimate Std. Error  t value     Pr(>|t|)
(Intercept) 21.5234286  2.6204170 8.213742 4.679259e-09
estriol      0.6081905  0.1468117 4.142656 2.712299e-04