Rows: 12 Columns: 2
── Column specification ────────────────────────────────────────────────────────
Delimiter: ","
chr (1): Choices
dbl (1): Votes

ℹ Use `spec()` to retrieve the full column specification for this data.
ℹ Specify the column types or set `show_col_types = FALSE` to quiet this message.
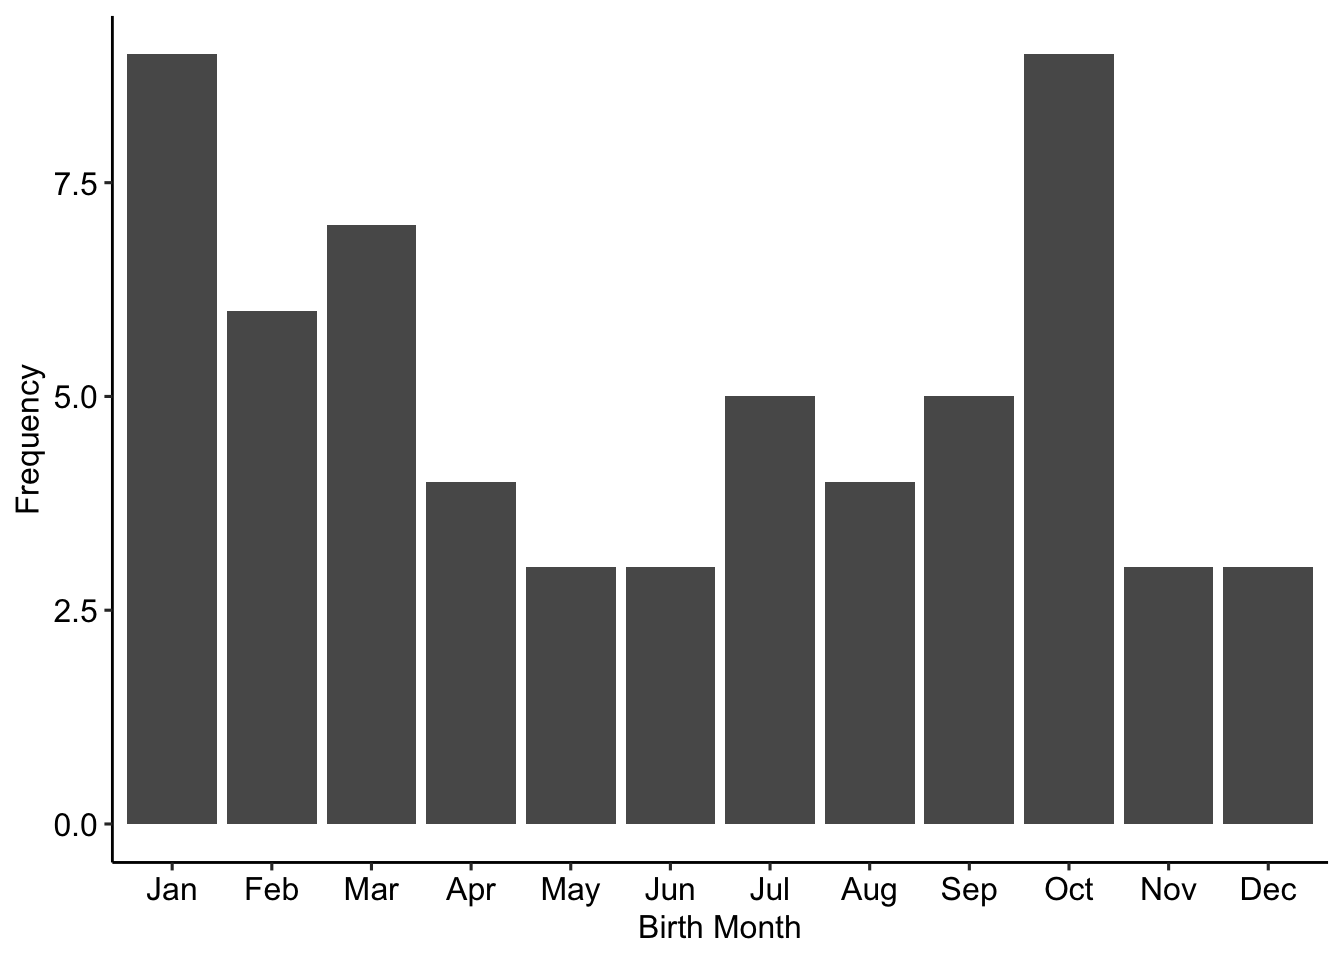
# Make sure the months remain ordereddf$Choices <-factor(df$Choices, levels=df$Choices)ggplot(df, aes(Choices, Votes)) +geom_bar(stat="identity") +xlab("Birth Month")+ylab("Frequency")
We can create a expectation column based on total votes and the number of months.
G_stat <-2*sum(observed *log(observed / expected), na.rm =TRUE)dof <-length(observed) -1p_value <-pchisq(G_stat, df = dof)alpha <-0.05# Significance levelif (p_value < alpha) {cat("Reject the null hypothesis")} else {cat("Fail to reject the null hypothesis")}
Fail to reject the null hypothesis
p_value
[1] 0.4885846
G_stat
[1] 10.2121
We can also do this test directly using R:
chisq.test(df$Votes, p =rep(1/12, 12), rescale.p =TRUE)
    Chi-squared test for given probabilities

data:  df$Votes
X-squared = 10.803, df = 11, p-value = 0.4599
Source Code
---title: "Lecture 02: Goodness of Fit Tests"format: html: code-tools: true---# Performing goodness of fit tests```{r}list.of.packages <-c("tidyverse", "ggpubr")new.packages <- list.of.packages[!(list.of.packages %in%installed.packages()[, "Package"])]if (length(new.packages)) install.packages(new.packages)library(tidyverse)library(ggpubr)theme_set(theme_pubr())```# Read the dataThis data was collected in class.```{r}df <-read_csv("https://gist.github.com/saketkc/622dc866f91c73e8b90540827f0f93ad/raw")``````{r}# Make sure the months remain ordereddf$Choices <-factor(df$Choices, levels=df$Choices)ggplot(df, aes(Choices, Votes)) +geom_bar(stat="identity") +xlab("Birth Month")+ylab("Frequency")```We can create a expectation column based on total votes and the number of months.```{r}df$expectation <-sum(df$Votes) /length(df$Choices)df```# Goodness of fit testNull hypothesis: The probability of birthmonths should be equal across the months (100/12=8.33% per month)```{r}observed <- df$Votesexpected <- df$expectationchi_square_stat <-sum((observed - expected)^2/ expected)dof <-length(observed) -1p_value <-pchisq(chi_square_stat, dof, lower.tail =FALSE)alpha <-0.05# Significance levelif (p_value < alpha) {cat("Reject the null hypothesis")} else {cat("Fail to reject the null hypothesis")}``````{r}chi_square_stat``````{r}p_value```Using G-stat:```{r}G_stat <-2*sum(observed *log(observed / expected), na.rm =TRUE)dof <-length(observed) -1p_value <-pchisq(G_stat, df = dof)alpha <-0.05# Significance levelif (p_value < alpha) {cat("Reject the null hypothesis")} else {cat("Fail to reject the null hypothesis")}p_value``````{r}G_stat```We can also do this test directly using R:```{r}chisq.test(df$Votes, p =rep(1/12, 12), rescale.p =TRUE)```